
University of Alberta Library staff share a great passion for information and we are always looking for new ways we can engage with it and make it more approachable for ourselves and our community. In March, when the COVID-19 crisis brought a sudden change to all our lives, some library staff with yarncraft inclinations had an idea to start a unique making project. The “Stitching the Curve” project seeks to capture the day-to-day values of COVID-19 cases across Canada in a work of yarncraft.
This project is modelled after many similar types of projects, such as scarves made from German train data or shawls that represent Montreal city council speaking time by gender. Data Physicalization is a trend where real-world data is translated into material objects. The intent of this process is to highlight information in unique ways, engage with data in a more hands-on fashion and, in some cases, produce a final object that serves as a representation of a particular social issue.
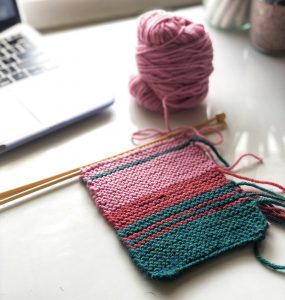
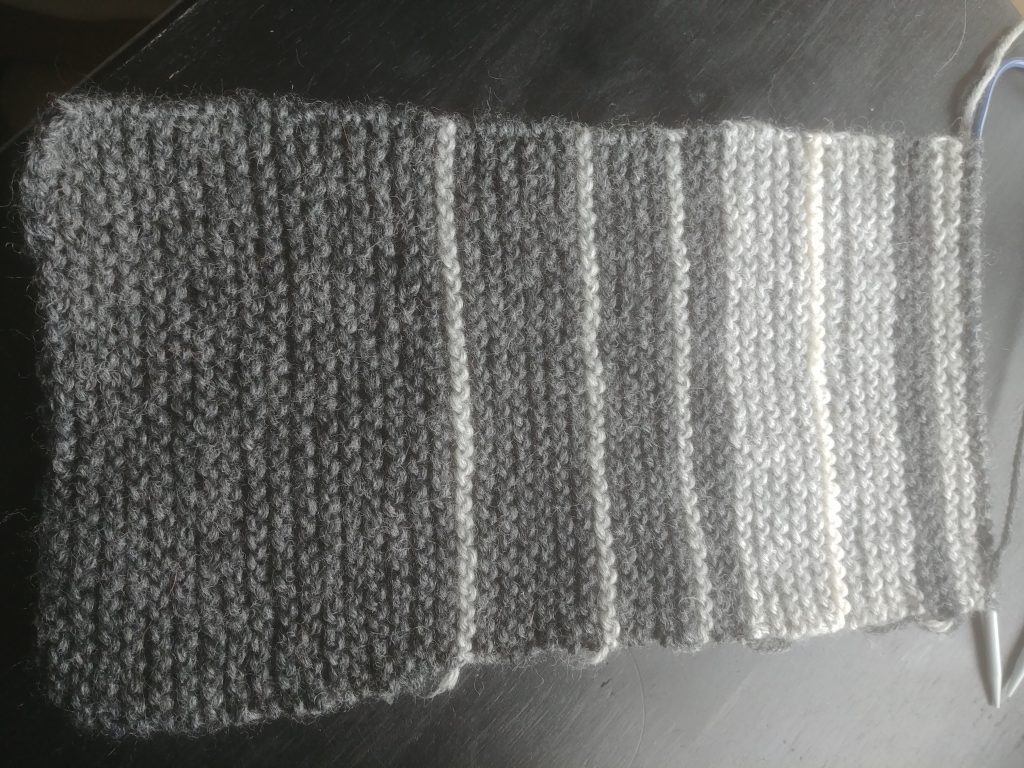
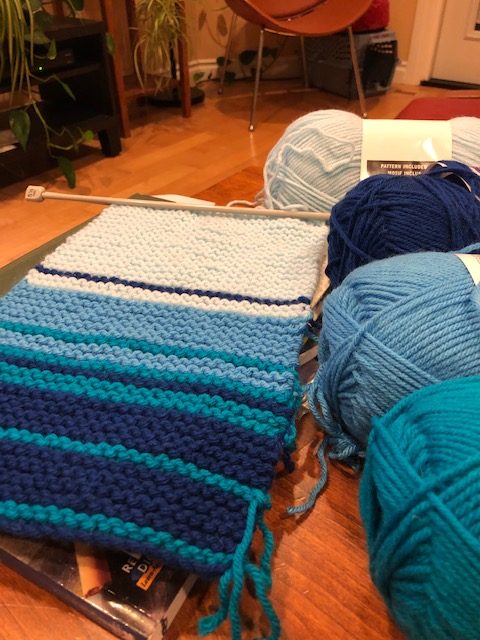
The goal of the Stitching the Curve project is to capture the very fluid data of COVID-19 cases across the country – data that is impacting everyone. The project has enlisted eleven members of our staff, across various departments. We are each knitting, or crocheting, a strip of material for each province and territory in Canada. Our colleague, Digital Scholarship Technologies Librarian, Peter Binkley has created a script to update this data daily from the CSV feed of Health Canada’s Coronavirus disease (COVID-19): Outbreak update site. Project participants are using whatever materials they have at home and selecting four different colours, each representing a range of case numbers: colour 1 represents 0-5 cases, colour 2 6-25 cases, colour 3 26-100 cases and colour 4 100+ cases. When time permits, participants check the datasheet and knit two rows (front and back) in the colour assigned to their day’s numbers. This will produce a long striped piece of fabric that, when we can all return to work, will be sewn together to form a blanket that represents the data from all of Canada. The full details of the project are available in our public project document.
It has been over a month of stitching now, and the project is proving to be interesting and impactful for us all. Thus far, those of us managing the group have learned much about how epidemiological data is fluid and that criteria for gathering information varies quite a bit across the country. We have had to make adjustments to the script producing our data a few times. As we knit the data, we are learning just how chaotic the COVID-19 situation is. We are learning to embrace the chaos and accept the discrepancies and changes; much as our public health officials must while making life-saving decisions. Many of us have noted that this is a data archiving project that unites us together, even though we are all separated.
I asked the group for their thoughts on the project so far:
“The practice of working with COVID-19 data has become a steadying contemplative ritual in my days. It combines so many things I love – information, documentation, community and making — and allows me an opportunity to be present to the reality of what is happening, and to remember the people this data represents.”
– Hailey Siracky
“This has been a really engaging project. It’s nice to be part of a group project while we’re all stuck in our homes, and crocheting statistics for each day helps me engage with the data in a meaningful way. I think we’ll end up with a diverse combination of colours and textures once it all comes together.”
– Kara Blizzard
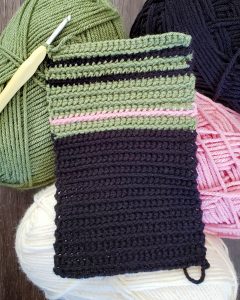
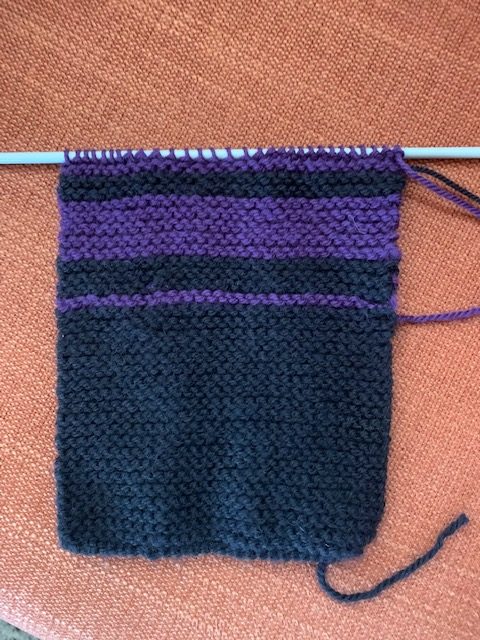
“I was excited to join this project as an easy knitting project to pass the time, and be part of a collective ‘something’. My province is New Brunswick where the numbers have been extremely low, which is wonderful, but I am always conflicted when I am knitting, as my swatch is mostly black with a few lines of dark purple. The dark colours for low numbers, and lighter for high numbers seem to conflict with my ideas of ‘good’ and ‘bad’ colours or representations of intensity. While I knit, I have thought a lot about the numbers and how they are low in New Brunswick, which presumably is because of the small population, but I wondered if there are other reasons why. I also have thought a lot about why the numbers might fluctuate beyond the actual number of cases of COVID-19. The testing parameters are constantly changing which could also lead to wild fluctuations and day-to-day variations, like weekend numbers, usually being lower. I hope that the numbers continue to be low in New Brunswick, even if my colours are a bit gloomy…”
– Connie Winther
The Stitching the Curve project is serving as a trial run for several of us who work in the Library’s Digital Scholarship Centre. For some time we have been exploring the idea of forming a Data Physicalization community that would bring together students, faculty and anyone interested, to work on projects that manifest information in unique ways. For those who wish to follow our progress on social media, we are using the hashtag #stitchingthecurve on both Twitter and Instagram. For further information on the project, feel free to contact Hanne Pearce at hanne.pearce@ualberta.ca.
2 comments
LIked & shared the knitting project with my church knitting/crocheting group at Paradise Valley United Methodist church in Phoenix AZ.
interesting project, Hanne et al – thanks for posting, I’ll be watching the progress