Once upon a time in early 2020, a few library staff in the Digital Initiatives department had an energetic lunchtime conversation in which we extolled our amazement of recent projects that used data and yarncraft to create physical artifacts. The practice is called data physicalization and you can read more about it in an earlier news blog post. At the time we were most familiar with knitting projects, like the German Train Scarf. As librarians who work with information and data as part of our everyday work, we were fascinated by this practice and wondered if data physicalization would be useful for teaching about data. None of us knew it at the time, but several weeks later we would all be working from home due to the first major lockdown of the pandemic.
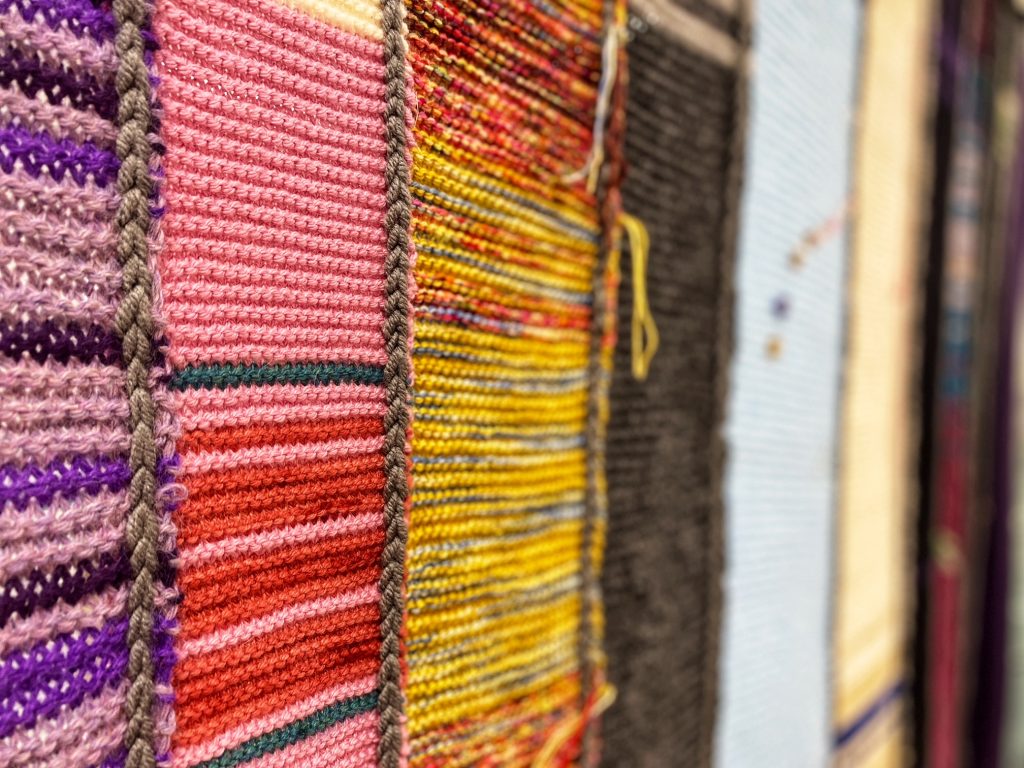
One Saturday morning shortly after the lockdown began, our colleague Peter Binkley tweeted that the German Train scarf had fetched a hefty price at auction. This spurred a Twitter conversation about starting our own project, yet again. The idea blossomed quickly, and earnestly, into something real. We were at the beginning of an emerging pandemic and the entire world was suddenly being bombarded by case counts and R-values. It seemed like a good moment to take on a project that would bring us together as we were working apart.
Within a week we had obtained permission to start the project, developed a project plan and drafted an email to recruit other library staff to help us. Would we get any interest? Were there enough knitters amongst us? We were pleasantly surprised when, within a day, we had 11 knitters from many different departments all lined up to knit COVID-19 case data from each province in Canada.
We tried to keep it simple and allowed everyone to use materials that they had at home. Peter used his coding skills to find us a reliable data source. He also wrote some code that would retrieve the data for us, putting it into a spreadsheet that listed cases for each province. We used a range of four different colours, each representing a range of case numbers:
- colour 1: 0-5 cases,
- colour 2: 6-25 cases,
- colour 3: 26-100 cases,
- colour 4: 100+ cases.
Participants referred to the datasheet and knit two rows (front and back) each day in the colour assigned to that day’s numbers. This produced a long striped piece of fabric that we would stitch together as a blanket once we all could come together again.
With these plans in place, we stitched onward. The pandemic lasted longer than any of us would have imagined. We all struggled with disruptions and changes to our lives. At times the stitching was difficult, particularly when cases rose higher. Stitch by stitch, month by month, our work became long swatches. Some of us ran out of yarn, and some of us had to add additional markers to days when case numbers rose significantly above 100. We wanted to be sure they stood out.
The stitching taught us about the cases affecting lives in Canada. Over time we could see lighter curves emerging and observe data collection patterns, as well. Others took interest in our work. We were interviewed about the project on the news and radio. We received emails from many interested parties asking about our project from all over North America. We have even done conference presentations on the project.
As the project has progressed, our lives have changed. Some colleagues left for roles at other libraries and some changed to different roles – but everyone remained dedicated to the stitching. The project became quite meaningful for us all. Eventually, we had to decide how long we would stitch, as the pandemic showed no signs of ending, even when vaccines began to roll out. We decided to cap our work at one year: from March 1, 2020, to February 28, 2021. This would make the final product large but also manageable.
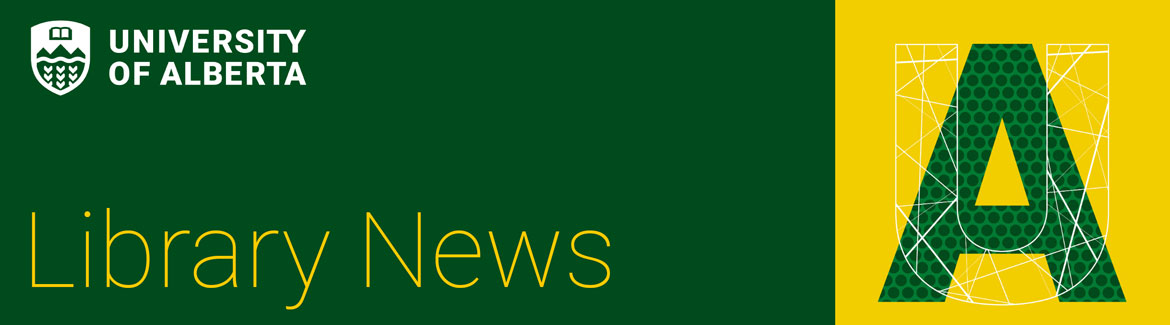
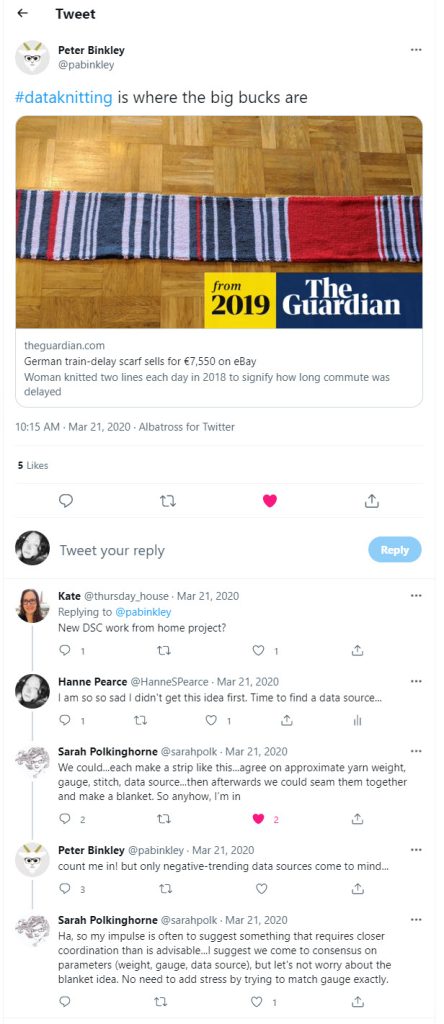
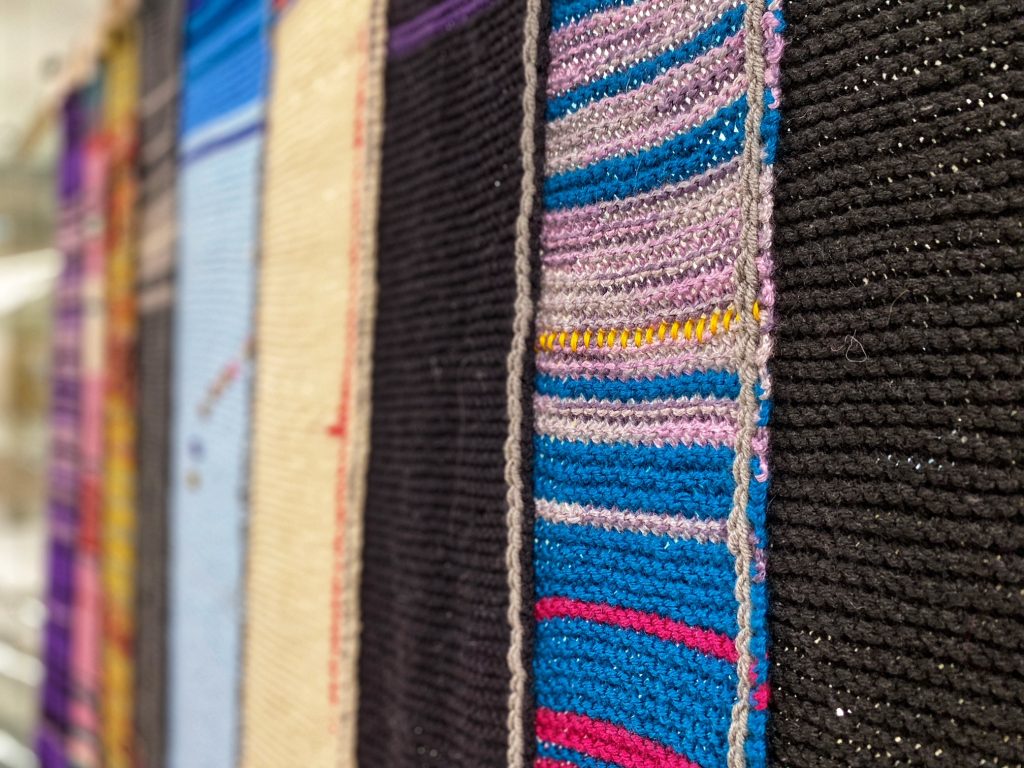
Two years, four months and 24 days later, the project we have called “Stitching the Curve” is now complete. We have finally finished the project and assembled the pieces into a blanket that now hangs like a tapestry with all swatches arranged geographically to demonstrate the shifting data across our nation. Our dedicated stitchers from west to east were: Hanne Pearce, Hailey Siracky, Sarah Polkinghorne, Natasha Nunn, Christine Brown, Peter Binkley, Connie Winther, Brenda Wolfe, Maria Tan, Kara Blizzard, and Lucinda Johnston. We also send our thanks to Kate Cawthorn who was a librarian intern with us when we started the project and helped a great deal with the project planning.
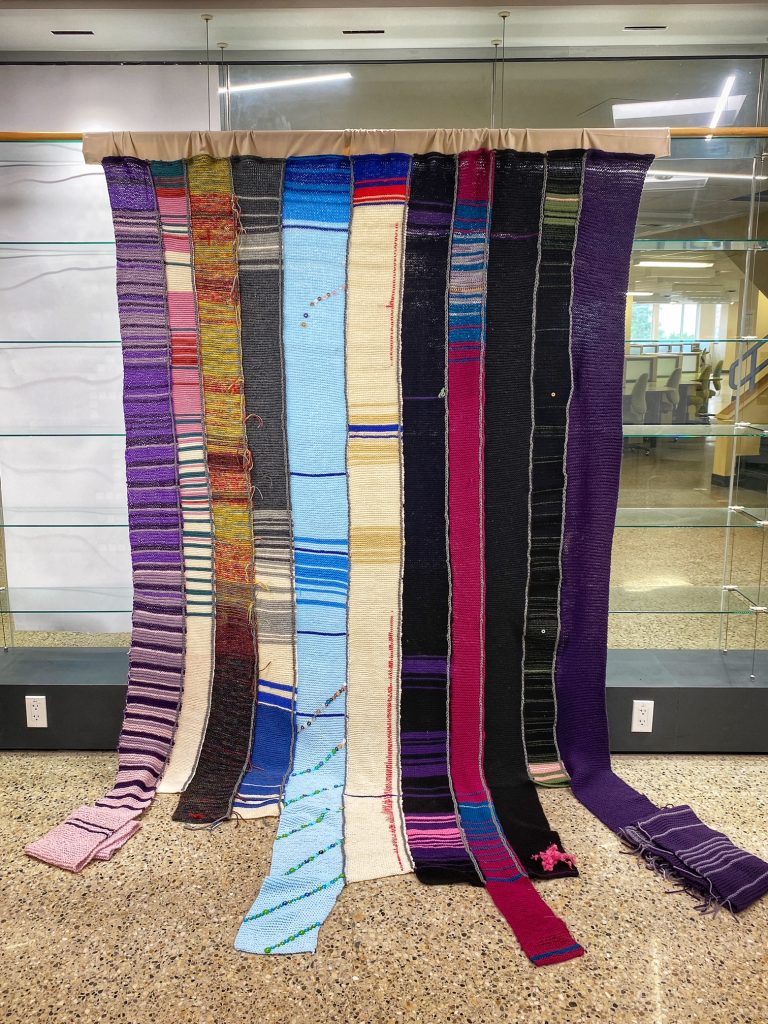
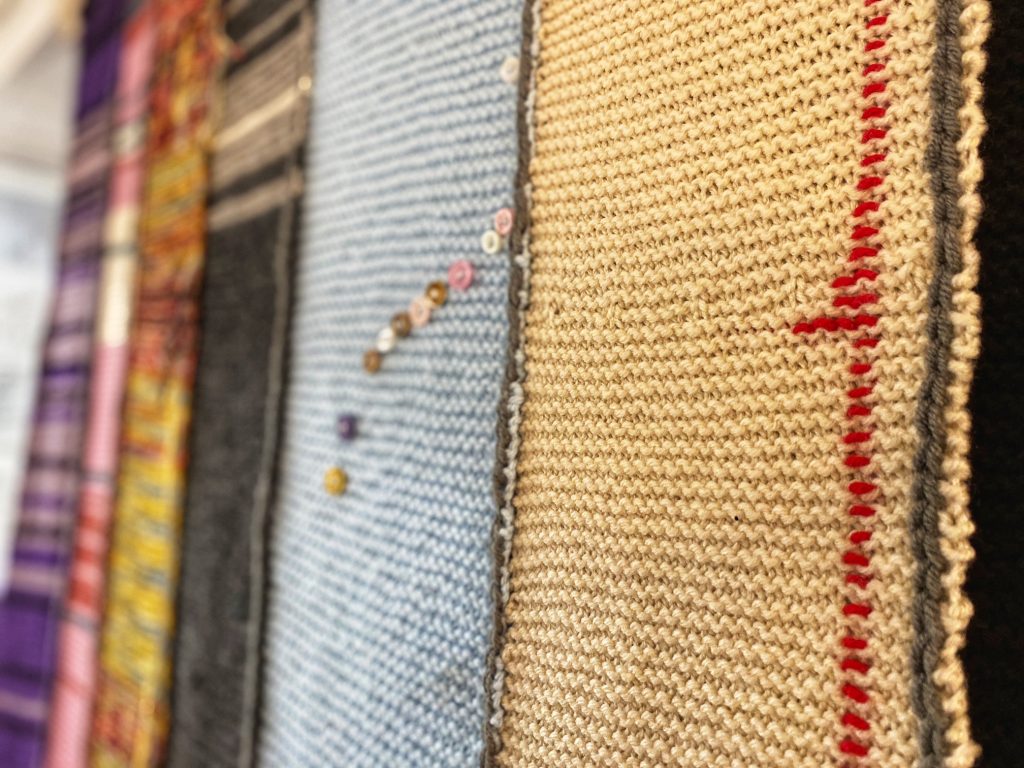
The final piece is a vibrant kaleidoscope of colours. It measures 1.6 metres wide and approx 4 meters long at its longest swatch*. Looking at it, if you know the code of the data, you can read a lot about COVID-19 in Canada during that first year. It shows the bright consistently high cases of Ontario and Quebec, the case-count roller coaster that the Prairie Provinces and BC rode, and the darker hues of the Maritimes and North demonstrate smaller case counts of more remote regions. On closer inspection, you can see the rhythmic striped patterns where provinces were not reporting COVID cases on weekends, and the small markers and memories that some stitchers affixed to days of importance.
We are pleased with the variegated living piece we have created. It is a patchwork that one might call “rough around the edges”. This is because we chose to make each of our pieces an embodiment of our pandemic experience. We have learned a great deal more from this project than we anticipated: about the pandemic, data physicalization and ourselves. We are thrilled that the Royal Alberta Museum has decided to keep it as part of their pandemic collection and we hope it will live on to teach others about this time. We are now working towards taking the experiences from this project and using them to potentially provide students with data physicalization experiences through the Digital Scholarship Centre.
*You may wonder why the swatches are different sizes, and that is due to gauge. Knitters and crocheters will know that the final dimensions of a piece of knitted or crocheted fabric depend on several factors that include: the weight of the yarn used, the size of the needle or hook and the unique tension of the stitcher. As stitching the curve came together during the pandemic, we used yarns and tools we had available to us, and we each stitched at our own tension. This is why even though we all stitched the same number of days, the swatches differ in size!